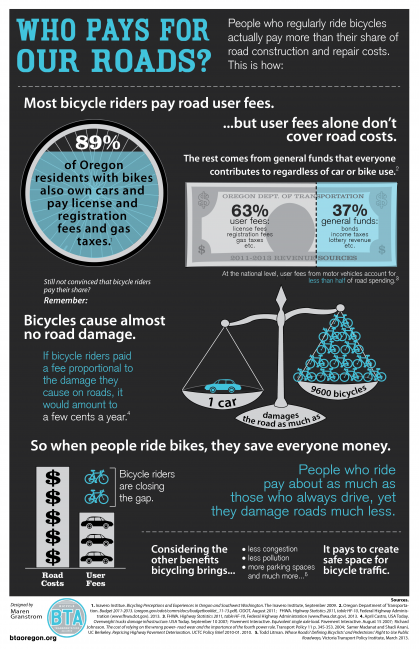

One car damages the road about as much as 9,600 bicycles. If bike riders had to pay a fee for their wear and tear on roads, they’d be writing checks for a few cents per year.
In other words: When people ride bikes, they save everyone money.
Those are the facts the Portland-based Bicycle Transportation Alliance is spreading with the new infographic below. The BTA says it’s designed to “start a conversation” about the ways we pay for our road system, despite a funding regime that Communications Director Will Vanlue calls “kind of a mess and hard to understand.”
“I think the people who aren’t very aware of this don’t think a lot about road funding,” Vanlue explained Monday. “When you’re going to the store you’re not thinking how does this government agency put roads here, you’re just thinking, ‘I want to get to the store.'”
Since Facebook-friendly infographics are a big way that complicated facts can spread from person to person these days, it’s great to see bike advocates looking for ways to use them. That’s especially true since we seem to be approaching a point at which local transportation funding will be forced to change, due to falling gasoline consumption and rising construction costs.
“If this goes well I hope to do two more,” Vanlue wrote in an email. “One that goes more into the other non-road costs associated with riding (savings to the rider), and another that goes more into the external economic benefits of riding (savings to the community).”
The fully original infographics were designed by BTA intern Maren Granstrom.
As for the facts of the infographic, there are some wrinkles: In the City of Portland, unlike in many other cities, the local transportation budget comes almost entirely from auto-related fees. That’s why our unusual success in reducing auto dependence over the last 17 years has been so rough on the city’s street budget. Vanlue said the BTA “made a conscious decision to move away from that granular level of data with this infographic.”
“Having more bikes on the road and fewer cars is going to mean smaller maintenance budgets, bottom line,” Vanlue said. “Eventually we’re going to be flying electric sky-cars, and somewhere between here and there we’re going to have to get rid of the gas tax. What do we do to fund our roads before those flyng cars come along?”
“One way we can reduce costs in the short term until we have a better plan is just to have more bikes on the road,” he said.
— For more on where the City of Portland’s money comes from to pay for transportation, see our story on the PBOT Financial Task Force Report from back in February.
Update 11:20 am 11/14: An earlier version of this infographic incorrectly reported the split between user fees and general fund taxes, overstating the statewide general fund contribution by 15 percentage points. It also characterized some transit costs as “road” costs. We’ve replaced the old infographic with the correct one. The BTA issued the following correction on Wednesday:
We’d like to share our reasons for making the corrections we did:
Categorizing bonds as a user fee. We originally categorized “bonds” as a non-user fee. Based on the source of revenue that ODOT relies on to repay bonds, this was inaccurate.
“Transportation” costs versus “road” costs. The first version of our graphic implied to some that ODOT’s revenue addresses “road” costs, when the picture is actually much more broad. The revenue also pays for things such as trails and other transportation facilities out of the on-road right-of-way.
Percentage of User Fees versus General Funds. In order to make sure we’re categorizing User Fees and General Funds accurately, here’s a list of what we’ve included in each category, based on information from ODOT’s 2011-2013 financial reporting:
- User Fees
- Motor Fuels Tax
- Part of Federal Funds (portion from Highway Trust Fund)
- Weight Mile Tax
- Driver and Vehicle License & Fees
- Bond/COP Sales
- General Funds
- Part of Federal Funds (portion not from Highway Trust Fund)
- Other Transfers to ODOT (includes cigarette tax, local government match on construction projects, Parks & Rec fee collection)
- General Fund
- Lottery Proceeds
- Sales and Charges for Service
- All Other Revenue