
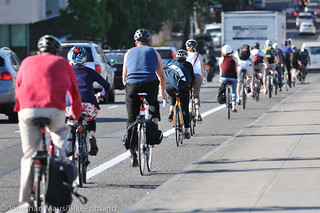
(Photo © J. Maus/BikePortland)
In a report released this morning, the Portland Bureau of Transportation (PBOT) says bicycle traffic counts for 2012 were up 3.3 percent over 2011 levels. These counts, which have been conducted annually since 1991, provide an important barometer for how many people are riding bikes in Portland. In addition to bike traffic volumes, the counts also tally gender and helmet usage. PBOT uses a mix of automated “hose” counts as well as manual counts by staff and volunteers. For the 2012 counts, volunteers manually counted 38,500 daily bicycle trips across a record 216 locations throughout the city — which PBOT says translates into more than 190,000 daily bicycle trips once the two-hour peak period counts are extrapolated out.
Here’s the summary of 2012’s numbers (taken directly from the report):
- Bicycle use in Portland continued its two decade long upward trend.
- 2012 bicycle counts showed a citywide 3.3 percent annual growth compared to the same locations counted in 2011.
- Bicycle counts showed a one-year decline in both NW and SW Portland.
- Bicycle traffic on Portland’s five principal bicycle-friendly bridges (Broadway, Steel, Burnside, Morrison and Hawthorne bridges) showed the highest number of bicycle trips since annual counts began in 2000/2001.
- Of 216 locations counted, 69 (32 percent) had daily bicycle traffic of more than 1000 trips.
- Since the 2000/2001 counts, the overall trend in bicycle traffic was up 211 percent; more than a tripling in use.
- Helmet use remained at historic high levels, with 80 percent of all people wearing their helmet.
- Helmet use is highest in SW Portland (90 percent) and North Portland (83 percent) and lowest in East Portland (63 percent). Helmet use in 2012 continued to be more prevalent among female riders (86 percent) than for male riders (77 percent).
- Female riders represented 31 percent of bicyclists citywide, remaining essentially unchanged since 2003.
Of Portland’s seven districts, northeast and east Portland showed the largest ridership increases over 2011 with a 9.3% and 11% increase respectively. On the flip-side, northwest and southwest (not including the central city) Portland showed a 5.7% and 6.6% decrease in ridership.

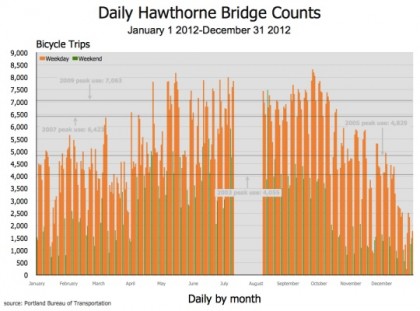
Another highlight of this year’s count report are daily bike trip counts for the Hawthorne Bridge which gives us our best sense of how seasonal weather changes impact bike ridership. The chart below shows the daily 2012 counts compared to summer time peaks from 2009, 2007, 2005 and 2003. “While the graph demonstrates the drop in bicycle use associated with the seasons,” writes the report’s authors, “it also demonstrates that winter bicycle use in 2012 was generally higher than were the summertime peaks from 2005.”

-Click to enlarge-
2012 was the first time PBOT has included count data from the Morrison Bridge. When it went in, the County (who owns/manages the span) and PBOT hoped the Morrison would alleviate the bike traffic crunch on the Hawthorne. So far, it seems to be underperforming. The Morrison had just 860 daily bicycle trips in 2012 compared to 8,136 daily trips on the Hawthorne. The Broadway Bridge was second to Hawthorne with 4,432 daily trips followed by the Steel with 3,311 and the Burnside with 2,055.
PBOT uses these counts to measure performance toward their goal of “making the bicycle an integral part of daily life in Portland” (they also rely on U.S. Census and City Auditor data).
Take a closer look at the numbers by delving into the full report here (PDF).