
Using ODOT traffic crash data and their own data on transportation infrastructure Metro’s State of Safety report has found that roadway collisions cost our region $958 million a year — that’s significantly more than congestion.
The report also lays bare one of the nagging issues for local transportation planners and a central theme of the Mayor Sam Adams administration: Portland’s large, multi-lane arterials are unsafe. In what report authors refer to as one of the “most conclusive relationships” in the study, they found that a disproportionate amount of the serious crashes in our region occur on arterial roads.
Streets like Tualatin Valley Highway, 82nd Ave, SE Powell, McLoughlin Blvd (in Clackamas County) have much higher rates of fatalities and serious injuries than neighborhood streets or even freeways.
The report found that Between 2007 and 2009, there were 151 fatal collisions in the Portland Metro region, killing 159 people, and an additional 1,444 collisions resulting in incapacitating injury. In total, the report says, those collisions cost the region $958 million a year in property damage, medical costs, and lost productivity, “not to mention the pain and suffering from the loss of life.”
By comparison, Metro’s very influential 2005 Cost of Congestion report found that traffic jams could cost the region $844 million a year in lost productivity by 2025.
Metro Councilor Rex Burkholder says that making road safety improvements, “could help the economy more than fighting congestion.”
The 104 page report was put together by Metro along with a “Regional Safety Workgroup” made up of federal, state and local transportation agencies, researchers and safety specialists. It was spurred by Metro’s Regional Transportation Plan (RTP), which calls for a 50% reduction in fatal and serious injury traffic collisions by 2035.
Here are a few of the key findings:
- Arterial streets have the highest rate of fatal and severe injury crashes, for all road users: motorists, bicyclists and pedestrians.
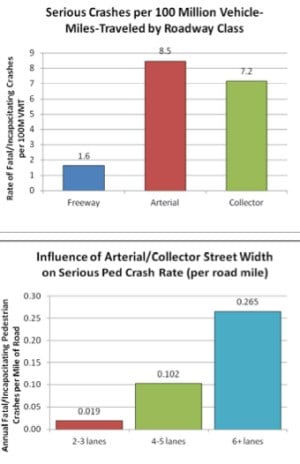
- Crash rates rise on surface (non-freeway) streets with more lanes, and are significantly higher on those with six lanes or more.
- Surface (non-freeway) streets with four lanes or more have particularly high fatal and severe injury crash rates for pedestrians.
- Speed is a contributing factor in 26% of serious crashes, while aggressive driving is a factor in 40% of serious crashes.
- Alcohol or drugs are a contributing factor in most fatal crashes.
- For pedestrians, fatal and severe injury crashes happen especially often after dark.
- Nighttime serious pedestrian and bicycle crashes occur disproportionately where street lighting is not present. 79% of serious pedestrian crashes and occurring at night and 85% of serious bicycle crashes occurring at night happen where lighting is not present, as compared to 18% of all serious crashes occurring at night. [This puts an interesting twist on the tendency of authorities and the media to blame victims in these collisions for wearing dark clothing.]
Beyond documenting the financial and tragic toll roads take Metro crunched the numbers and published many interesting charts and graphs to put this problem into perspective. One chart shows the rate of serious collisions (fatal or serious injury) in all 28 cities in the Portland metro area. Portland came in 9th and six of the top 10 are in Clackamas County.
Unsafe conditions on our major arterials is one of the biggest takeaways from this study. The chart below shows serious crashes by type of roadway:
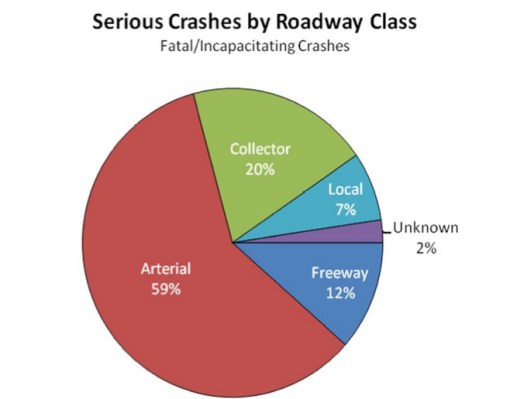
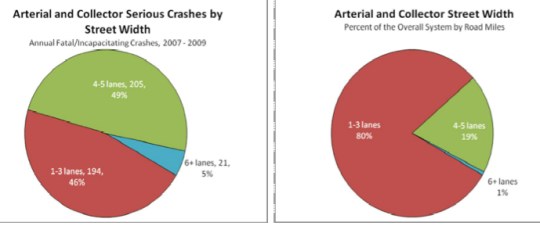
Despite making up just 19% of the total system, 49% of all serious collisions happen on 4-5 lane arterial roads:
Wider roadways are the location of a disproportionate number of serious crashes in relation to both their share of the overall system (Figures 3-4 and 3-5) and the vehicle-miles travelled they serve (Figure 3-6). The crash rate increases dramatically for roadways with 6 or more lanes.
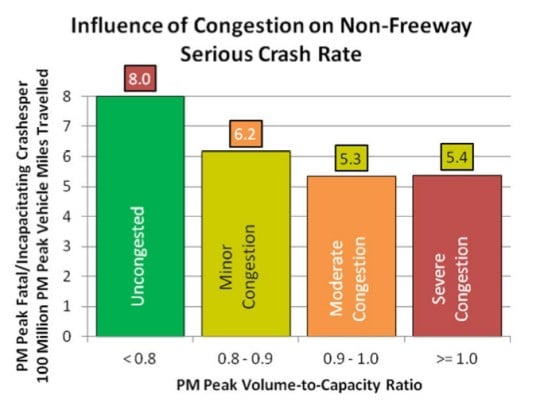
Another interesting conclusion in the report was that congested (non-freeway) streets are safer. The report states, “The serious crash rate per vehicle-mile travelled is highest for uncongested non-freeway roadways.” (This comes just a day after PBOT told us they had to increase auto capacity in the Williams Ave Safety Project because they are worried about congestion.)…
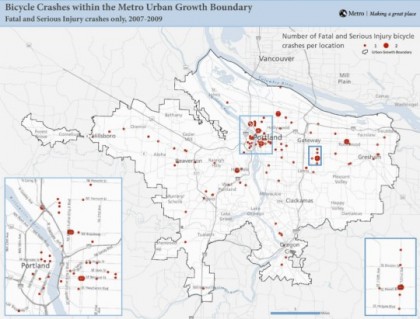
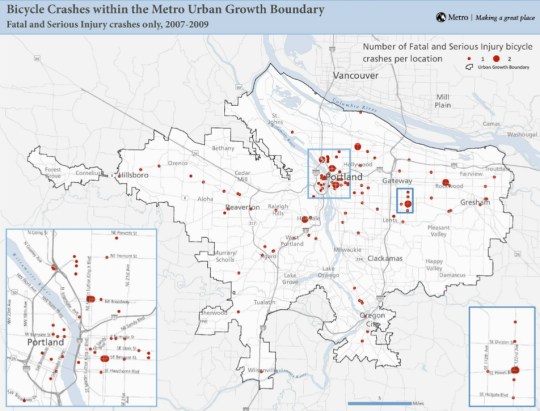
Interestingly, the report found that Portland has 68% of the region’s serious bicycle collisions, as well as the highest rate of serious bicycle collisions per capita and per vehicle mile traveled. (52% of those collisions happened on arterials.)
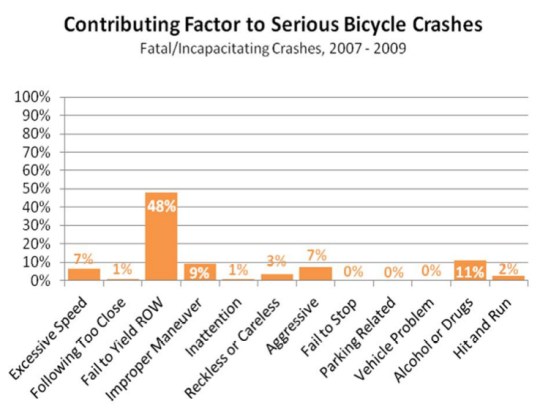
When it comes to the cause of serious bicycle crashes, failure to yield the right of way is the most common…
Check out this map that shows the location of all serious injury and fatal bike collisions between 2007 and 2009;
The report also laid out a number of implementation strategies to improve safety. Here area few of them that caught my eye:
- A regional arterial safety program to focus on corridors with large numbers of serious crashes, pedestrian crashes, and bicycle crashes.
- Safety strategies that match solutions to the crash pattern and street and neighborhood context, rather than an approach of simply bringing roadways up to adopted standards
- Policies that reduce the need to drive, and therefore reduce vehicle-miles travelled
- A focus on safe cycling facilities and routes, particularly in areas where serious crashes are occurring
- More detailed research on the relationship between land use patterns and safety
That first bullet point is essentially what PBOT is already doing with their High Crash Corridor Program. Kudos to them for identifying this problem years ago and acting on it. Hopefully this report adds urgency to their effort and builds the coalition working on it.
I can’t help but think this report is a very big deal. It’s one thing for advocates, the community and a Mayor to talk about this stuff; but it’s another thing entirely for our metropolitan planning organization to publish an official report with such revealing data and strong recommendations. This report should be used by everyone from citizen activists fighting for neighborhood projects to politicians looking for cover to do the right thing.
— Learn more at OregonMetro.gov and download the full report here (25mb PDF)