
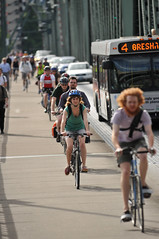
trips are made by bike over
Portland’s four main downtown
bridges every day.
(Photo © J. Maus/BikePortland)
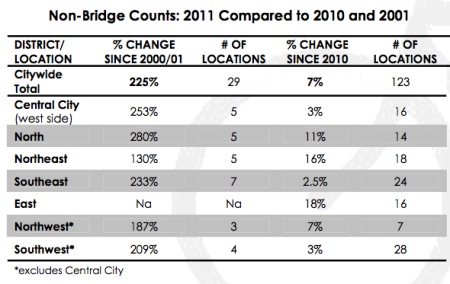
PBOT released their 2011 Bicycle Counts Report today (PDF). The numbers show that overall there were 6.4 percent more trips made by bike citywide in 2011 compared to 2010. On new neighborhood greenways, the jump in ridership was even greater. At the 11 newly-developed neighborhood greenways (a.k.a. bike boulevards), PBOT recorded a jump of 61 percent.
The Going Street neighborhood greenway saw a particularly large spike with a daily count of 1,585 bicycle trips at NE Going and 9th last year compared to 1,040 daily bicycle trips in 2010.
Overall, bike traffic in Portland is up 219% since 2001. In addition to trip data, the counts also shed light on the gender split (big news on that below), reported collisions, helmet use, and seasonal averages over time.
On the four main downtown bridges — the Broadway, Steel, Burnside and Hawthorne — bicycle trips were up 3.8 percent. In 2011, there were a record 18,257 daily bicycle trips over those four bridges which accounts for over 15 percent of all vehicle traffic (and that’s with an 18 percent drop on the Broadway due to streetcar project related detours and closures). The busiest bridge is the Hawthorne, which has an average of 8,044 daily bike trips. The Steel Bridge follows with 3,703 average daily trips.
Starting in 2010, PBOT counted bicycle traffic on the Hawthorne Bridge throughout the year — not just in the warm, dry summer months of July through September that the rest of their counts are taken in. This means they can now offer a detailed comparison of summer and winter counts.
According to the 2011 report, the amount of bike trips taken on the Hawthorne Bridge during October 2011, 6,662, is more than the summer counts in 2007. The 4,401 trips taken in December of last year are equal to the summer counts in 2004. This means that each year, people who ride in Portland are getting tougher and more people are riding throughout the cold and wet months!
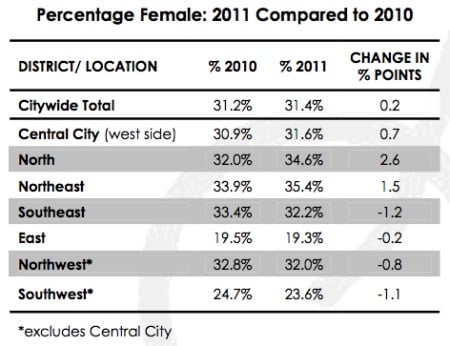
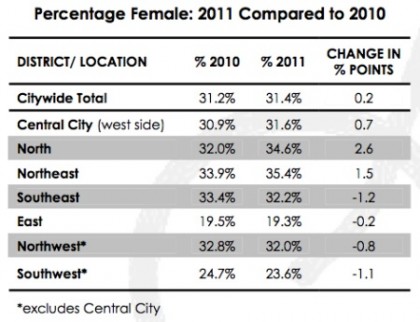
When it comes to the gender split, the overall male/female counts increased a paltry 0.2 percent between 2010 and 2011. Overall in 2011, 31.4 percent of people counted on bikes were women. The number of women on bikes is highest in northeast Portland (35 percent) and lowest in east Portland (19 percent). The count location with the lowest number of women riders was SW Barbur and Capitol Blvd where they represented just 7 percent of the total number counted.
There was one location where PBOT recorded more female than male riders. Of the 260 average daily bike trips at N. Failing and Missouri, 58 percent were women.
The highest non-bridge location counted in 2011 was SE Harrison and Ladd Circle with 3,600 average daily trips.
More riders than ever were recorded as wearing helmets. Citywide, 80 percent of people counted wore them, that’s up 3 percent over 2010.
PBOT also tracks collision data; but because they rely on state DMV records, the numbers lag one year behind the bike counts and are hard to extrapolate too much from. That being said, the number of reported collisions has not gone up for the third year in a row. There were 321 reported collisions involving bicycles in 2010, that’s up from 287 in 2009 and 265 in 2008. PBOT officials say the rising number is a result of the Portland Police Bureau investigating more bicycle collisions and that it is not “representative of changes in actual crash activity within the city.”
Geek out to all the stats and graphs in the full report here (PDF, includes counts from previous years).
*Below is section on count methodology taken from the report:
Bicycle counts are conducted by volunteers and City of Portland staff, who visually count and then record passing bicycles at street corners and on bridges during two-hour time slots called a “peak period.” In the last ten years, PBOT added several automatic bicycle counters on bridges and trails. These counters provide a more complete picture of the ebb and flow of bicycle traffic over the course of the day and throughout the year.
For visual counts, volunteers record counts for each direction during peak periods at a location and report the number to PBOT staff. A 24-hour average bicycle count for the location is calculated by multiplying the recorded peak period count by five. This is a standard traffic engineering calculation that has been validated by comparing extrapolated visual counts with comparable results from automated counters.
Prior to 2008 the majority of counts were concentrated in the center of the city. Since then, PBOT has worked to increase the total number of count locations and expand the locations across the city, with extra focus on adding locations in Southwest and East Portland. In 2008, there were 121 locations and in 2011 there were 156.To determine year-on-year percentage change in counts, PBOT staff compare only those locations and their count totals that were recorded for both years. New locations and the total counts recorded at them are not compared to previous years’ totals.