

How much is a human life worth?
Unfortunately on this site, we sometimes deal with fatal and very serious crashes. Have you ever stopped to consider the financial and economic impact of those tragedies? The Portland Bureau of Transportation has. In fact, it’s common for government agencies to ascribe a value to human life to justify investments and policies.
Last week, a reader passed along an interesting article in the New York Times about how the monetary value of human life is used by federal agencies. The EPA puts it at $9.1 million, the FDA says its $7.9 million, and it’s $6 million at the DOT.
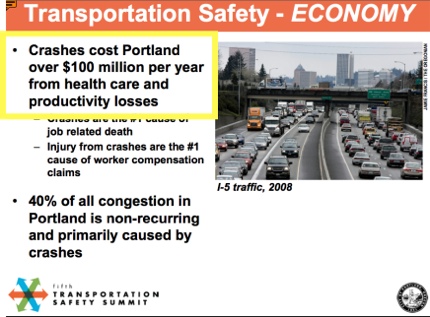
A few years ago, I recall Portland Mayor Sam Adams used a similar tactic when making a presentation about his Safe, Sound and Green transportation funding initiative. More recently, you might have seen the slide below presented by Adams (who, as PBOT manager, says safety is his number one priority) at the recent Transportation Safety Summit (yellow highlight is mine)…
Curious, I contacted PBOT recently to ask if they use a standard, monetary amount when calculating the financial impact of fatal and serious injury traffic crashes on our city. Greg Raisman is one of PBOT’s chief traffic safety experts. He says they use metrics from the National Safety Council, a widely respected organization chartered by the U.S. Congress.
The NSC tabulates two types of costs related to traffic injuries. Here’s how Raisman says he defines them:
- Costs of Traffic Injuries: The calculable costs of motor-vehicle crashes are wage and productivity losses, medical expenses, administrative expenses, motor vehicle damage, and employers’ uninsured costs.
Comprehensive Costs of Traffic Injuries: In addition to the economic cost components listed above, the following comprehensive costs also include a measure of the value of lost quality of life which was obtained through empirical studies of what people actually pay to reduce their safety and health risks.
The NSC places the average ‘Economic Cost per Death’ (as of 2009) at $1.29 million, an “incapacitating injury” at $67,800, and so on. The average ‘Comprehensive Cost’ is $4.3 million per death, $216,800 per incapacitating injury, and so on.
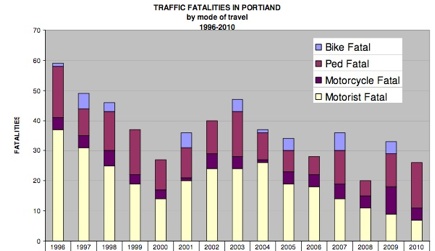
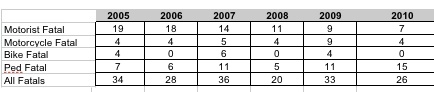
So, what does all this have to do with bike safety? Well, as bike ridership has skyrocketed over the last decade in Portland, vehicle crashes (of all types) have come down. Last month we reported that in 2010 Portland experienced their lowest amount of fatal traffic crashes since 1925.
– Download larger image (with additional data) as a PDF –
Fewer people driving cars means fewer people are dying and being seriously injured; and it means Portland experiences less of the negative economic impact of those crashes.
Put another way, according to data supplied by PBOT, between 1994 and 1998, the ‘comprehensive costs’ of the 235 traffic fatalities and nearly 12,000 injury crashes in Portland tallied $2,436,387,400 (that’s billions). For the most recent four year period, 2004 through 2008, the amount had dropped by a third to $1,629,913,300 (thanks to a drop in fatalities to 151 and a decrease in injuries to about 9,600).
Here’s a chart that lays it all out:

– Click to enlarge-
Many people equate unfettered automobile access to roadways with economic success, but we also know that the more we drive, the more crashes we suffer. What these numbers show is that those crashes have a significant economic impact. If we truly care about the bottom line, we’ll make sure our transportation system is just as safe as it is efficient — for all types of road users.