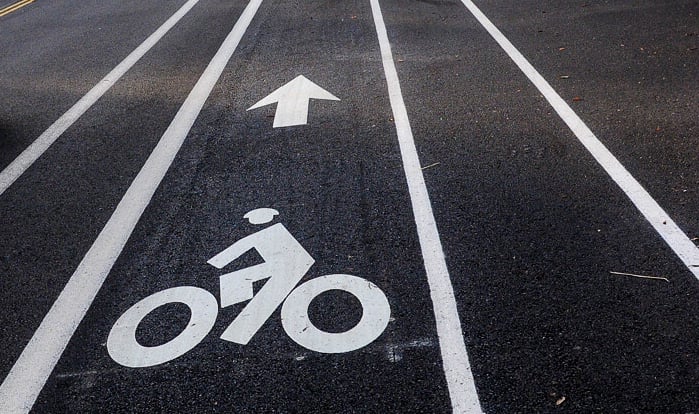
Just released from the City of Portland are impressive stats for daily bike traffic over the four main Portland bridges. These stats are from this summer and they reflect the largest jump in bike traffic since records started being kept back in 1992 and how a nearly 15% jump since last year alone.
The bridges surveyed are the:
- Hawthorne
- Steel
- Broadway
- Burnside
Here’s a quick comparison:
- 1992 – 2,855 total bike trips
- 2004 – 8,875 total bike trips
- 2005 – 10,192 total bike trips

Congratulations to everyone that helps make Portland a great place to ride a bike. These numbers are the fruit of your efforts! If you like charts and graphs, I’ve posted a few others on my Bike Safety page.

