
(Images courtesy Ride Report)
Ride Report, the locally based mobile app that’s trying to bring new insights into bike planning by making it much easier to estimate stress levels and count bikes, is up and running.
To celebrate the release this week of their free iOS app (Android is in the works), the Ride Report team gave us the keys to their internal map so we could take a look at some of the interesting details they’ve already turned up about biking in Portland.
Here’s how the app works: like other fitness apps, it uses your iPhone’s hardware to detect how fast you’re moving in which direction, and uses that to automatically detect whether it’s happening on a bicycle. After your bike trip ends, it sends you a brief alert, asking you to give the ride a quick “thumbs up” or “thumbs down”:

I’ve been using the app myself for a week. I have yet to rate a single ride “thumbs down” but it actually gives me a sense of accomplishment and I’m happy to be laying the groundwork for the day when I need to report a problem.
By combining about 30,000 of those ratings during the app’s testing phase, Ride Report has assembled a very detailed stress map of Portland’s bikeable core.
Before we dig in, an important caveat: The more users Ride Report gets, and the more different kinds of users Ride Report gets, the better these maps will become. Right now its user base of about 400 active beta testers is heavily dependent on the social and professional networks of Ride Report’s creators and probably some BikePortland readers who started following the project after our earlier coverage. Those populations probably skew it toward relatively experienced, passionate and (let’s say it) privileged bike users.
That said, to some extent stress is stress.
Another caveat: Knock Software CEO William Henderson, the lead creator of Ride Report, said one of his team’s early discoveries was that most bike trips are not rated as stressful. So even the routes with red ratings include plenty of non-stressful trips. But if one ride in ten were unpleasant enough for someone to give it a thumbs-down, that’d definitely still be a poorly performing route.
OK, with those things in mind, let’s see what their maps are finding so far.
Rush hour lights up Southeast Portland with stress
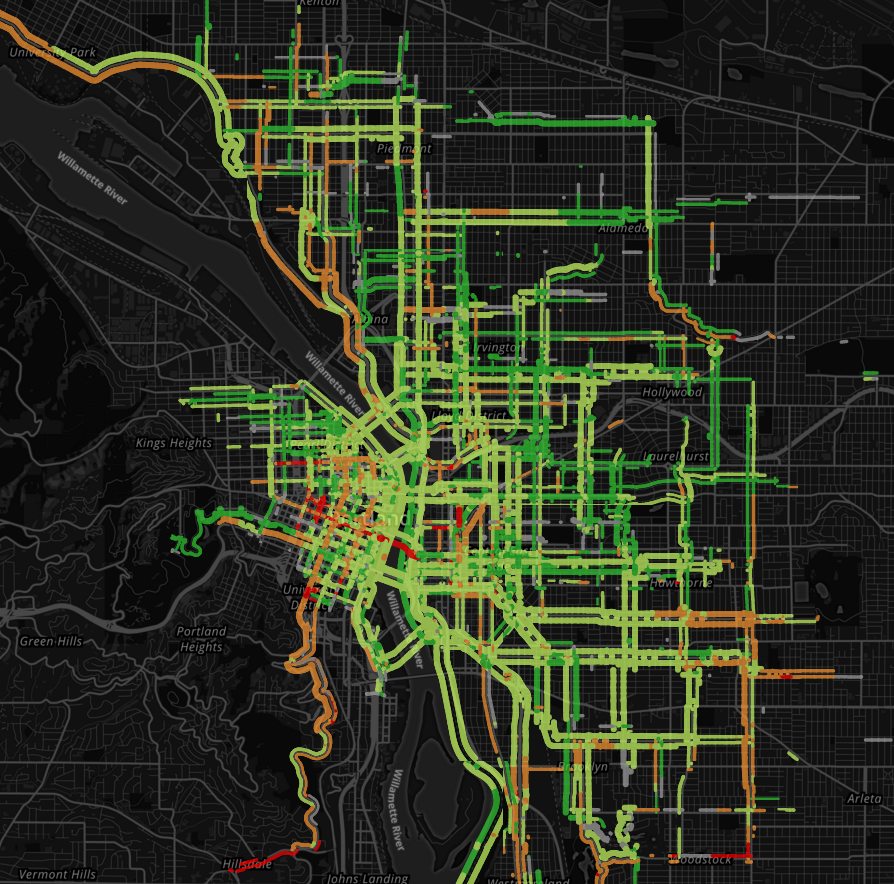
Here are larger versions of the maps at the top of the post. First, off-peak hours (trips taken during everything except the 8 a.m., 5 p.m. and 6 p.m. hours on weekdays):
And then peak (those three rush hours):
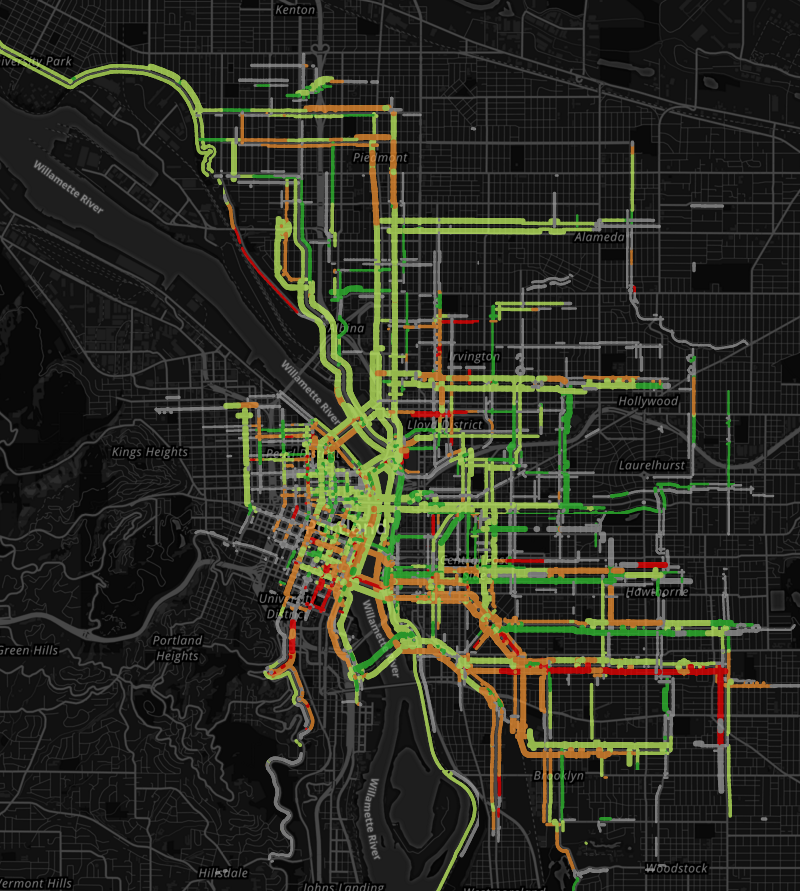
Stress patterns in several parts of the city change dramatically (check out Williams-Vancouver north of Alberta, and the Portland State University area) but none more than Southeast. Clinton Street flips from green to red almost all the way from 26th Avenue to 50th. Ladd’s Addition goes orange; so do the new buffered bike lanes on SE 17th Avenue between Powell and Holgate.
Almost all of this data was gathered before the trial diverters installed two weeks ago, so with Ride Report’s current user base it’s too early to learn anything about how well they’re working so far.
I’ve heard several people say in the last two years that they think reports of stress on Clinton Street are exaggerated. I suppose it’s possible that a group of complainers have also hijacked Ride Report and are deliberately skewing it. Alternatively, this data makes it pretty clear that Clinton becomes a very different street for three hours every weekday.
The Morrison Bridge path is rarely used except for local trips
Here’s the extended network of popular bike routes that cross the Hawthorne Bridge, Portland’s busiest:
Here’s the core rideshed for the Broadway Bridge:
Tilikum Crossing:

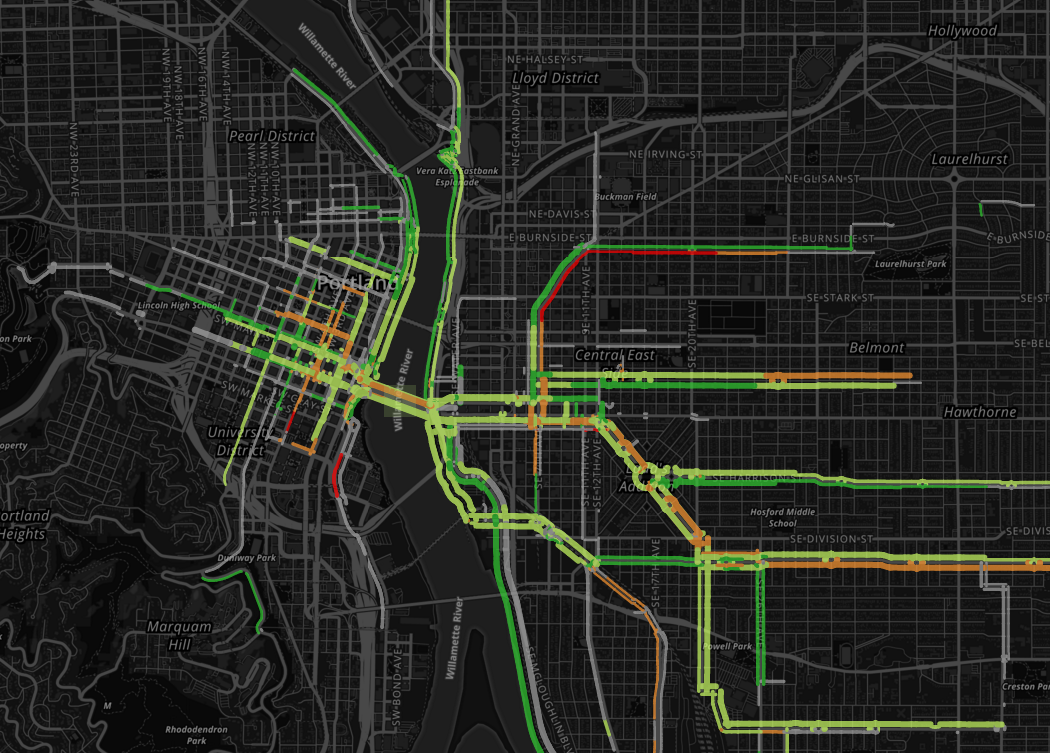
And here’s the network across the Morrison Bridge, in its entirety:
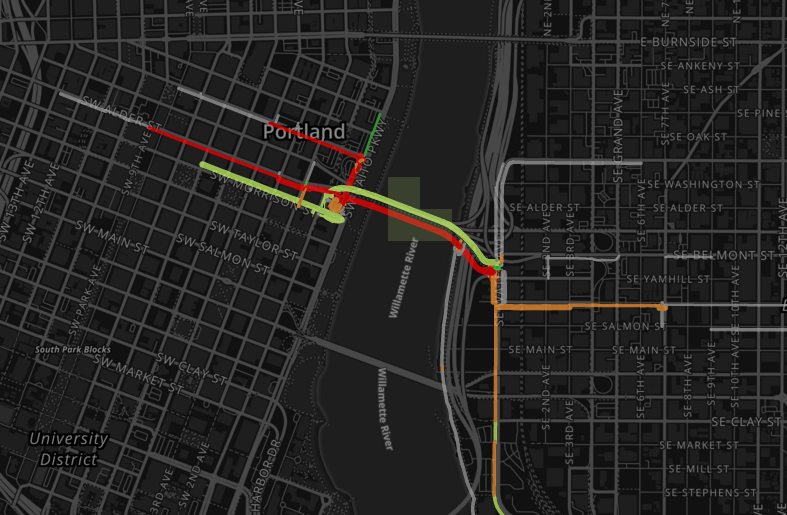
The gray lines suggest that a few trips across the Morrison actually go somewhere besides the central eastside and downtown, but not enough to be measured.
Another interesting question: eastbound traffic on the Morrison Bridge is marked as highly stressful despite having one of the best traffic-separated facilities in the city. Why? Based on the chart above, it seems to have something to do with the approaches from Alder, Stark and Naito on the west.
Advertisement

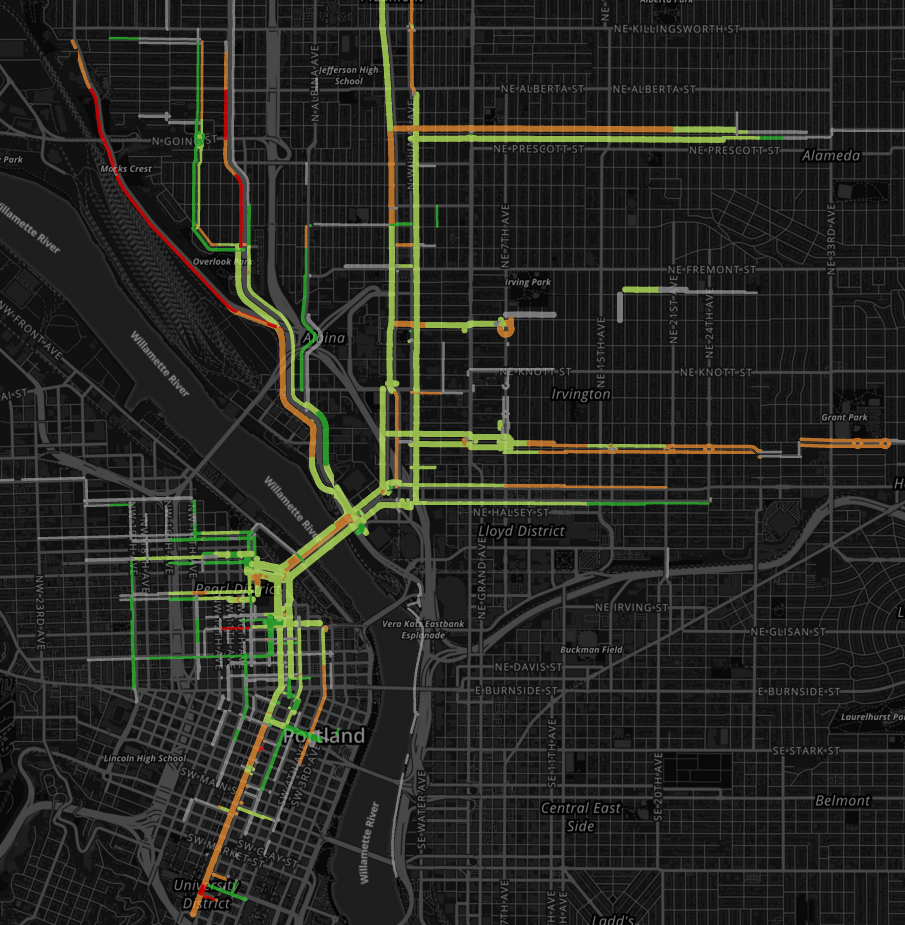
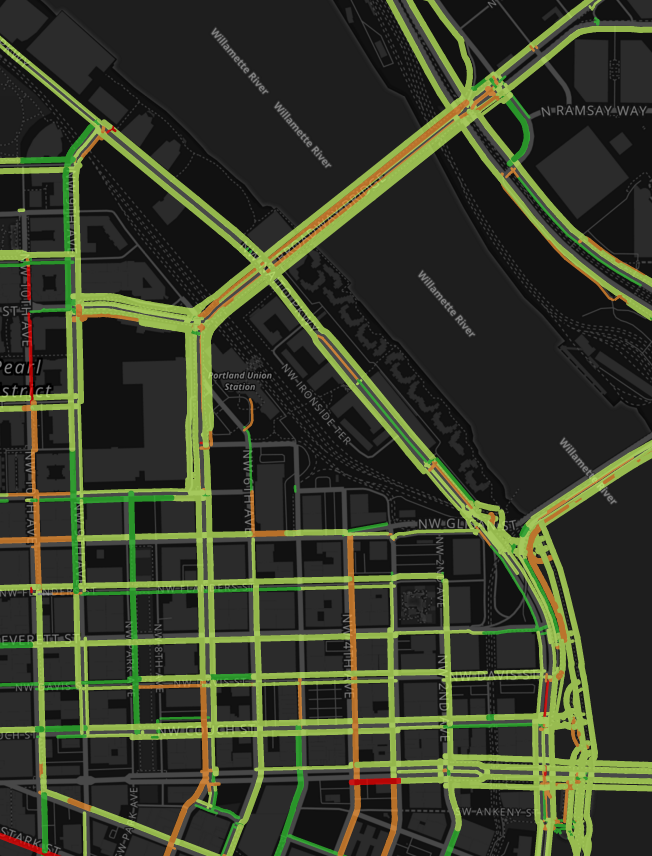
NE Weidler seems to have a problem
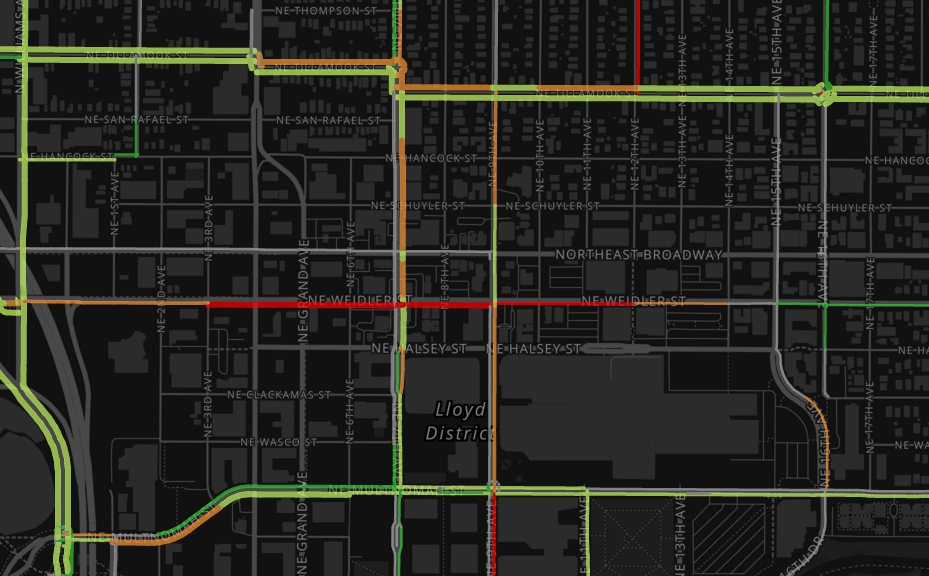
The eastbound bike lane on the right side of NE Weidler between 3rd and 14th jumps out as one of the city’s most stressful, especially during rush hours (pictured above). Why?
It’s hard to say for sure, but these blocks of Weidler alternate between blocks with a bike lane sandwiched between a through lane and a right turn lane; blocks with the bike lane in a door zone; and blocks with curbside bike lanes that cross the driveways of fast-food restaurants.
So does SE 6th
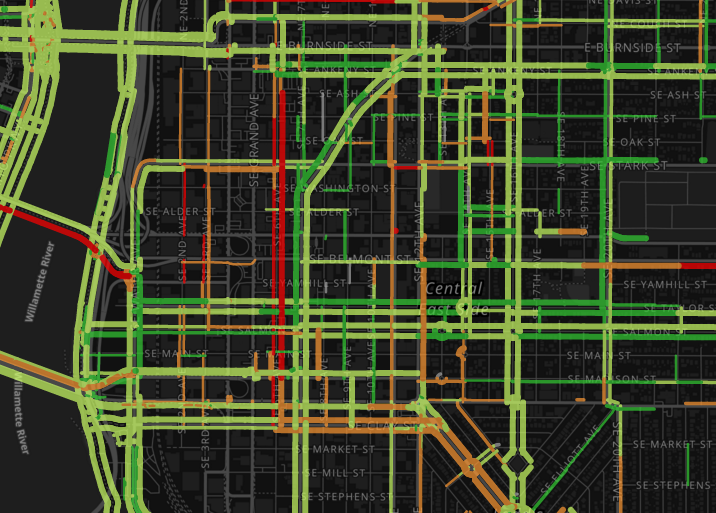
I rarely ride this street, so I was surprised to see this. It seems to be worse during non-peak hours, so truck volumes may be involved.
Broadway is a long streak of bad
The stretch of parking-protected bike lane alongside PSU apparently doesn’t help:
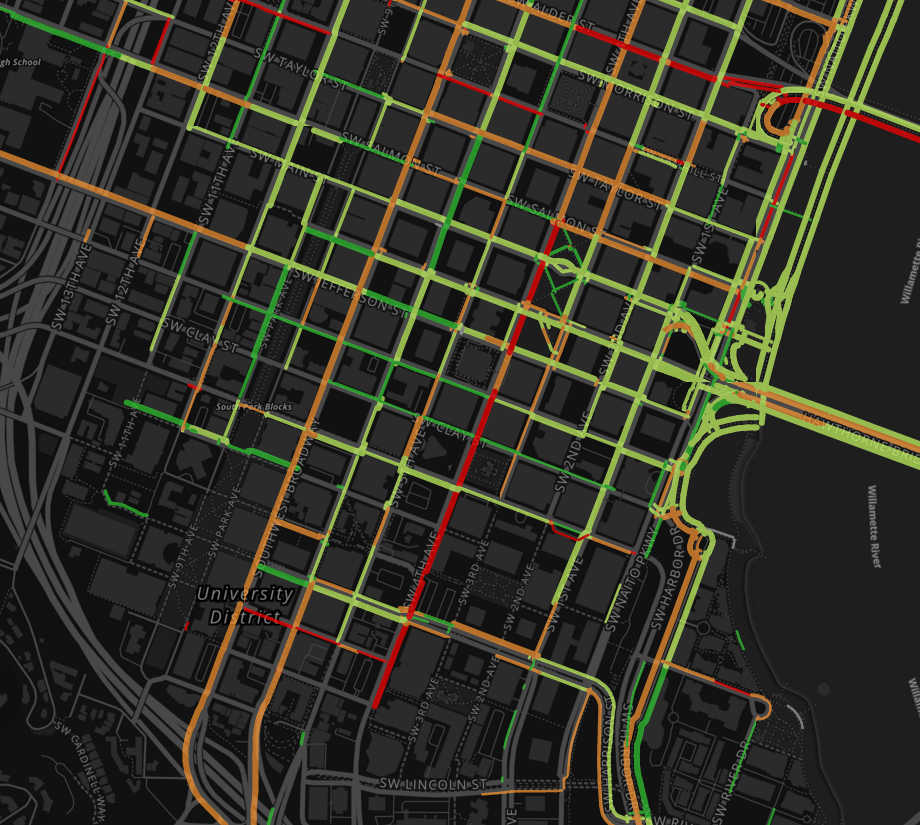
(Also note the trouble on SW 4th Avenue, which is one-way northbound; this part of downtown has no continuous northbound bike lanes.)
The one part of Broadway that actually performs well is the lead-up and crossing of the bridge itself:
I’ve focused here on the bad news turned up by Ride Report, though there’s good news too: south of Alberta the Vancouver-Williams corridor seems to be performing well. So does the current crossing of Interstate 84 at 28th Avenue and (surprisingly to me) the Burnside Bridge.
But the most exciting thing about Ride Report isn’t that it can find bad news. It’s that if enough people install it, it’ll be able to document the future changes on streets — new diverters on Clinton, better bike lane on Weidler — that turn bad news into good news.
If you’d like to log your own trips, check out their website to get the new app.
— Michael Andersen, (503) 333-7824 – michael@bikeportland.org
BikePortland can’t survive without paid subscribers. Please sign up today.