(Photo: J. Maus/BikePortland)
When it comes to the battle against bike theft, data plays a huge role. Online registration and listing services rely on data to aid in your bike’s recovery, the police use data to determine whether a bike is stolen or not, the public can use data to measure progress (or failure) over time, politicians often use data to determine whether or not a specific issue is worthy of their attention, and so on.
The latest numbers released by the Portland Police Bureau (PPB) are definitely worthy of attention. They show that bike theft is costing Portlanders well over $2 million a year and that at least 8 bicycles are stolen in our city every single day.
Just before the recent Bike Theft Summit, the PPB released their latest report (based on statistics from the Police Bureau Data System (PPDS)). Before sharing an analysis, keep in mind that improving the accuracy and availability of these stats is part of our larger effort on bike theft. I also want you to be aware of the following caveats:
- I’ve noticed a few inconsistencies and I’m still working to clarify a few numbers with the PPB.
- The 2014 numbers only go through October 31st, so I’ve made conservative estimates to arrive at annual numbers based on the past three full years of data.
- The PPB estimates cases of bike theft are under-reported by about 15-30%.
- These stats do not include bikes taken from residences/garages during burglaries (I’m not yet sure why). As many of you know, this is a huge chunk of the problem and we’ll be working on including these cases in a future report.
Even with those caveats, I think we have enough numbers to help us get a clearer picture of the problem. Here are my takeaways:
Bike theft has grown significantly since 2008
The chart below shows the number of reported cases from 2011 through October 2014 (I’ve estimated the total 2014 amount):

Going back further, I’ll use numbers reported by Sarah Mirk in her excellent 2010 article in The Portland Mercury. Mirk reported that there were 2,300 total reported cases in the 21 months between May 2008 and February 2010. That’s an average of 110 bikes reported stolen each month. In their most recent report, the PPB says there were 7,678 bikes reported stolen in the 34 months from January 2012 through October of 2014. That’s an average of 226 stolen bikes per month — a whopping 105% increase.
Based on my own estimates I think it’s possible that by the end of this year we’ll go over 3,000 reported bike thefts for the first time. That’s an average of about 8 bikes every day of the year.
Advertisement

Are thieves developing a finer taste for bikes?

(Source: PPB)
About half the stolen bikes in the PPDS are given an estimated value. In all of the past four years, bikes with a value of about $500 have accounted for the most thefts. One interesting trend in the numbers is that the average estimated value of a stolen bike has more than doubled since 2011 — from $320 to an estimated $732 in 2014. This could mean that thieves are getting more selective.
Also eye-catching in the latest report is the number of high-end bikes being stolen. Over 16% of them had an estimated value of over $1,000.
The number of bike thefts is close to the number of auto thefts
According to the PPB’s latest bike theft report, from January 2012 through October of this year there have been 7,678 reported bike thefts. One of my goals is to get better data to compare these numbers directly to other, similar crimes. For instance, the PPB’s online CrimeStats tool tells us there were 8,956 cases of “vehicle theft” in the same period. That number includes cars/trucks and motorcycles, which leads me to assume the number of cars stolen in Portland is similar to the number of bikes. We need more data to get a clearer picture of this comparison (I’m also curious about total estimated value of cars stolen versus bikes stolen).
Portland’s $2 million a year (and growing) problem
Using these estimated values, the PPB says the total value of property loss due to bike thefts is over $2 million per year. According to my estimates, that number spiked from just around $1 million in 2012. The huge increase is from a combination of more — and more valuable — bikes being stolen.
Put another way, in the 34 months between January 2012 and October of this year, Portlanders lost an estimated $5,435,750 in stolen bikes. That’s about $160,000 per month.
Downtown/northwest is where the action is
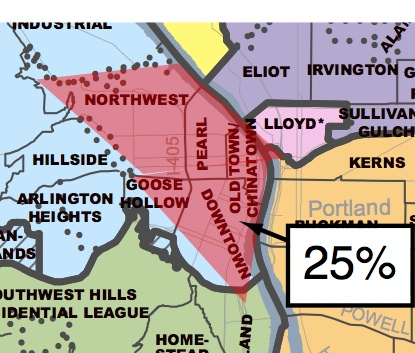
Over 25% of all reported bike thefts from January 2012 through October of this year happened in the five neighborhoods we typically think of collectively as “downtown.” The Pearl District, Downtown, Old Town/China Town, Northwest, and Goose Hollow accounted for 1,931 of the 7,678 bike thefts in that period. Downtown led the way with 780 thefts while Northwest and the Pearl District had 422 and 411 respectively.
Getting more police resources dedicated to this problem is one of our top priorities. When that happens, we know exactly where we’d like them to focus.
——
These stats are a good start; but we need to make them even cleaner and more complete in order to really grasp the state of bike theft in Portland. Hopefully someday all the local datasets — Bike Index (which is the same as ours), Project 529, and the PPB’s reports, will all be integrated into one.
Stay tuned to our coverage as we continue to raise the profile of this issue and take more steps forward.
— Download the PPB’s Bicycle Theft Trend Report 2014 here (PDF).