(Graphic: BikePortland)
The U.S. Census Bureau has released results of the 2011 American Community Survey. The Census reports that 6.3% of Portlanders surveyed use a bicycle as their primary means of transportation to work. This number represents a slight uptick from previous years, but is still within the margin of error. The last time there was a significant increase in this number was between 2007 and 2008 when Portland went from 3.9% of people biking to work to 5.9%. (For a look at the numbers prior to that, read our 2007 story, Bike commute mode split doubles in five years.)
By comparison, the number of people who say they primarily walk to work was also relatively unchanged, moving from 5.3% in 2010 to 4.9% last year. In fact, according to my research, none of the four major modes of transportation to work changed beyond the margin of error.
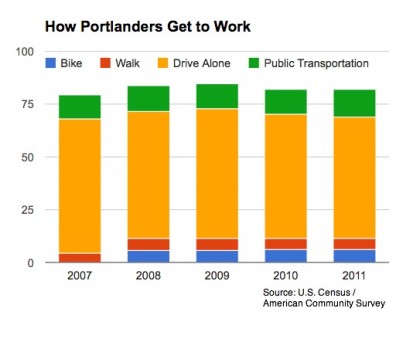
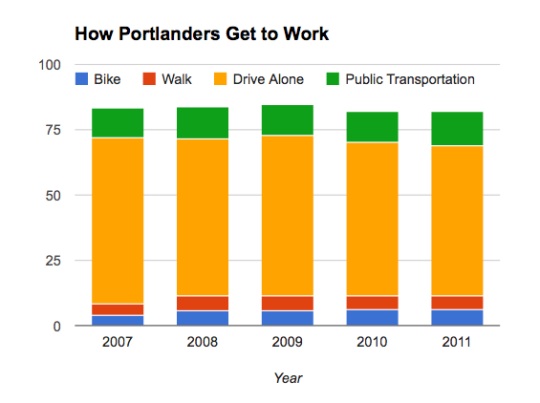
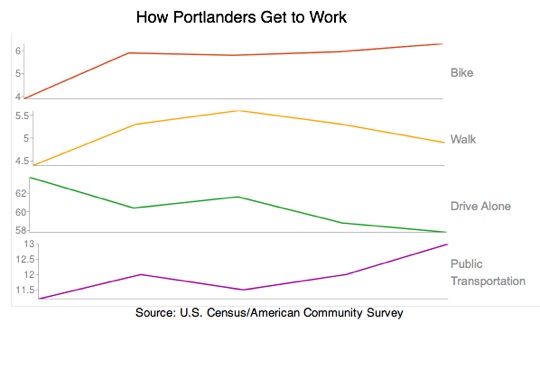
According to the latest numbers, the only work commute modes that have seen significant changes in Portland over the past five years are bicycling and driving alone. Although it hasn’t risen much in the past few years, bicycling to work has increased sharply overall since 2007. On the other hand, the amount of people who drive alone to has fallen significantly — from 64% in 2007 to 58% in 2011. The trend lines below show an even clearer picture of what’s going on (note the percentages on the left)…
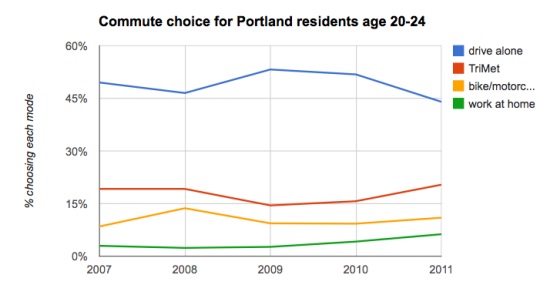
There has been a lot of headlines recently about how young people are spearheading this decline in driving. Michael Andersen of Portland Afoot took a closer look at how the latest numbers reflect on 20-24 year-old Portlanders. As you can see in Portland Afoot’s chart below, more young Portlanders are working from home these days; but when they do head out to work, the transit and bicycling numbers are on the upswing, while the drive-alone number is clearly dipping down.
A few caveats when thinking about these U.S. Census numbers:
- Here’s how the question appears on the survey form: “How did this person usually get to work LAST WEEK? If this person usually used more than one method of transportation during the trip, mark (X) the box of the one used for most of the distance.” The respondent is also only allowed one answer. “So, if they drove a car 3 days of the week and biked or took transit 2 days,” local bicycle planning consultant Jessica Roberts explained to me once, “their answer would have to be driving their car.”
- Planners tell me that work trips account for only one of out eight bicycle trips. So, it’s a big mistake to think that only 6% of Portlanders ride bikes.
- Planners also feel that these U.S. Census number tend to under represent mode splits.
Stay tuned for more on these numbers. I expect the League of American Bicyclists and/or Bikes Belong to share some national comparisons later this week.
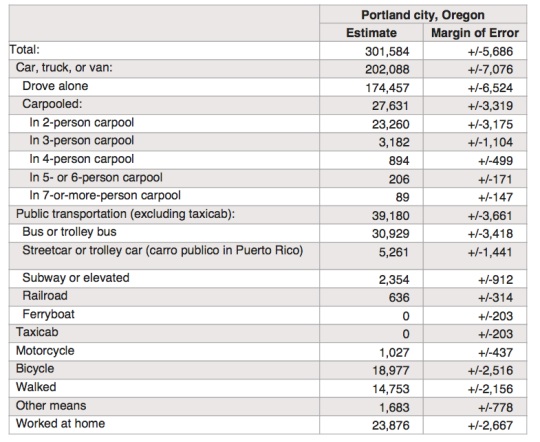
You can see the raw 2011 numbers below: