
A new report (PDF) released by the Oregon Health Authority reveals important data about the 18,131 Oregonians who went through the trauma injury system between 2010 and 2011.
The report provides an important analysis of both biking and driving injuries. Of all the injury “mechanisms” tracked in the report, traffic crashes were the leading culprit. (Falls were close behind in total number of injuries and they were the leading cause of deaths.) In addition to the data, the report’s authors have shared a list of recommendations to help lower the rate of traumatic injury in Oregon.
Before I share some of the findings, keep in mind that this data only applies to patients that went through the Oregon Trauma System, a network of 50 hospitals (44 are in Oregon, the others are in Idaho, Washington, and California). This data does not include people who were not transported to the hospital, people who were declared dead at the scene, those who refused care, and those who were treated at a non-trauma hospital. For context, trauma injuries make up roughly half of all hospitalized injuries.
That being said, let’s get into the numbers…
“Among the options to reduce injury, public policy that shapes individual behavior and community norms is proven to have the greatest impact.”
— From the report
Of those 18,131 injuries between 2010 and 2011, 7,750 people were entered into the trauma system due to injuries sustained while operating car/truck/van, a motorcycle, walking, or bicycling. Of those, 6,964 of the injuries involved a car or truck. People in cars suffered the most with 4,971 trauma injuries. Motorcycle operators were next with 889 motor-vehicle related injuries. Walkers suffered 711 trauma injuries due to collisions with motor vehicle operators and there were 313 injuries to people while bicycling. 107 of those injuries to walkers and 679 of the bicycling injuries did not involve a motor vehicle.
Interestingly, people bicycling (which the report calls “pedalcyclists”) were traumatically injured twice as often in collisions not involving motor vehicles (679 versus 313). I wonder how many of those were injuries that occurred during races and other competitions?
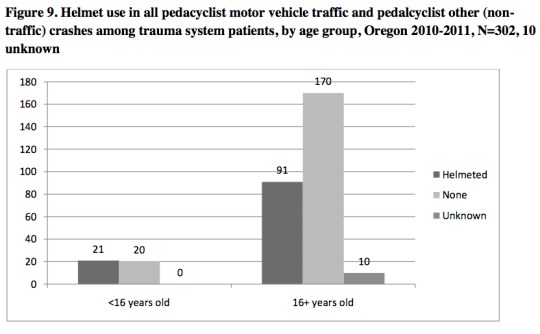
The report also revealed that 63% of the adults injured in a bicycle/motor vehicle collision were not wearing a helmet.
516, or just three percent of the 18,131 trauma patients died. Falls are the leading cause of fatal injuries with 219 deaths between 2010 and 2011. Vehicle and walking related injuries are next with 157 fatalities.
The report also tallied the injury rate per 100,000 people for the various causes of injury. Occupants of motor vehicles were injured at a calculated rate of 129.2 per 100,000 people. Bike riders (who either crashed on their own or collided with another vehicle) were injured at a rate of 24.8 per 100,000 people. Interestingly the rate of trauma patients injured while bicycling is slightly higher than that of people injured while riding a motorcycle (22.6 per 100,000).
The authors of this report listed several recommendations on how Oregon could curb the number of trauma patients. They said they would support, “an effort to mandate the use of bicycle helmets among riders over the age of 16 years.” Another thing they recommend is a new tax on alcohol to reduce the number of injuries from motor vehicle crashes. They also want to get public health officials more involved with planning at the Oregon Department of Transportation.
“Among the options to reduce injury,” the report’s conclusions states, “public policy that shapes individual behavior and community norms is proven to have the greatest impact.”
— You can download the entire report here (PDF).