
This story is by Greg Spencer, a writer and editor and proud dad of two bike-commuting kids. He’s also a volunteer with the local chapter of Families for Safe Streets.
In Metro’s draft 2018 State of Safety Report, previewed last month on BikePortland, the latest regional road crash data is analyzed, and it’s done for the first time from the perspective of Vision Zero, a policy framework that aims to eliminate deaths and serious injuries.
But some of the presented data do not reflect the Vision Zero ethos, which says that road safety is a shared community burden, not one that’s primarily on the backs of crash victims.
In adopting Vision Zero, Metro set a far more ambitious safety goal than the one in its last safety report, published in 2012. It aimed at halving fatal crashes by 2035, while Vision Zero strives to eliminate them. Vision Zero, a worldwide movement originating in Sweden in the 1990s, rejects the cold, cost-benefit approach to safety investments and instead takes an ethical stand that no deaths from road crashes are acceptable. It embraces a “safe system” view in which the onus for preventing deadly crashes falls equally on traffic engineers, lawmakers, police, car companies, licensing authorities, health care workers and more.
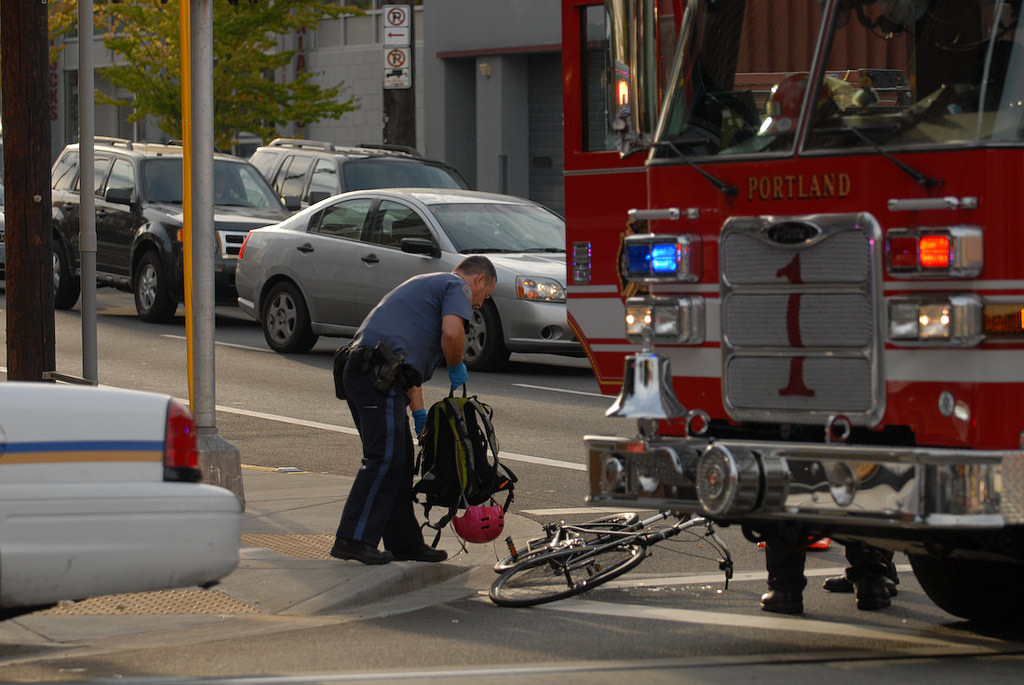
So when I saw the draft report’s breakdown of crashes by “contributing factor,” I was surprised that almost all the factors related to road-user behavior, and that almost none dealt with pre-existing problems with the travel environment. For example, there are no factors relating to the quality of the road itself, the posted speed or the presence or absence of crosswalks.
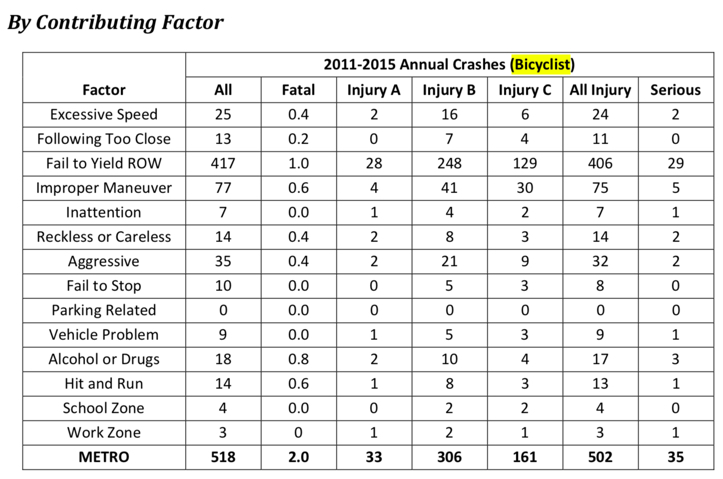
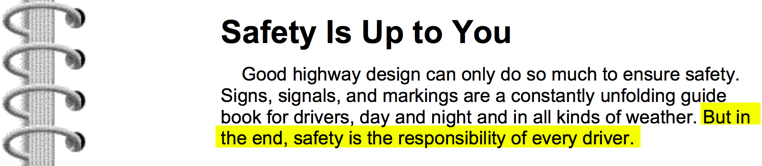
These factors are based on tick boxes on official crash report forms filled in by law enforcement officers. Aside from two of the factors — “school zone” and “work zone” — they all relate to supposed mistakes or infractions committed by the individuals involved. In my judgment, this reflects an outmoded view that the roads, rules and conditions are a given — and that it’s up to road users to adapt or die. (Or “Safety is up to you”, as you can see in this currently available road-user guide from the Federal Highway Administration.)
To be fair, the report does reflect extensively on other elements of the transport system. Although individual crash report forms fixate on road-user error, other information about crashes is recorded, and when analysed in the aggregate, patterns emerge that can inform improvements to the transport system.
For example, crash locations are documented and Metro’s draft report aggregates them to show that, for example, arterials are the most dangerous types of street in the Portland region per distance travelled — more dangerous than residential streets and more dangerous than freeways. The report highlights a positive correlation between the number of vehicle lanes on roads and frequency of crashes that occur on them. And it shows — no surprise to readers of this blog — that bicycle crashes occur at intersections much more often than in between blocks.
These points were highlighted by Lake McTighe, who manages the State of Safety report for Metro. I emailed her for a comment for this post, and she invited me for a coffee to explain Metro’s commitment to the system approach. “Contributing factors are just a part of it,” McTighe told me. “We think big steps forward are identifying locations of crashes in terms of the road classification, intersection vs. mid-block, and the number of lanes. This data also tells us whether nighttime crash locations had street lighting.”
These lessons supply useful evidence when Metro recommends such things roundabouts or timed traffic signals to make intersections more bike-friendly, McTighe said. Or when it suggests road diets that curb motor traffic by removing lanes.
Advertisement
“It’s significant that our data imply that adding lanes will have an impact on safety,” McTighe said, highlighting the tension between the need for safety and Oregon legal requirements for road capacity, aka “level of service.”
“One of the ways we’re trying to frame things is to get away from finding whose fault the crash was, and to move towards what can be done to make the roads safer.”
— Lake McTighe, Metro
Similarly, the report shows that the most serious crashes between motor vehicles are head-ons. That’s a good argument for more medians, McTighe said, pointing up Martin Luther King Boulevard as a good case study. The road, once similar to NE 82nd in terms of design and dismal safety record, was reconfigured in the 1990s with a tree-lined green median. Both streets are still counted among Portland’s “high crash corridors”, but MLK no longer has any of the city’s most dangerous intersections, while 82nd has six of them.
“One of the ways we’re trying to frame things is to get away from finding whose fault the crash was, and to move towards what can be done to make the roads safer,” McTighe said. That does sound more like Vision Zero. Even so, she agreed that the data in the draft State of Safety Report has its shortcomings. Perhaps the most glaring is the lack of speed information. The “contributing factors” include the category of “excessive speed”, but this is a relative term and not the same as absolute speed. It indicates that, according to crash-scene evidence or witness testimony, one or more of those involved was exceeding the speed limit or going too fast for conditions.
But, as stated in BikePortland’s coverage of the draft report, speed is a factor in most deadly crashes, including those where participants were traveling within the posted limit. Studies have shown a 60% fatality rate for pedestrians struck by cars going just 45 mph, a typical speed on major Portland streets. Oregon crash reports don’t even include the posted speed limit at the crash site, much less the actual speeds that cars on those streets travel at.
Part of the difficulty in getting this information into crash reports is the byzantine the way speed limits are legally recorded, McTighe said. Oregon has speed limit standards based on road classification. But local and regional authorities can set limits that deviate from those standards on a road-by-road basis. And they can change those limits over time as they see fit.
So in order to ascertain posted speeds for individual crash sites, “Someone would literally need to sift through PDFs in state records to find what was in effect at the time,” McTighe said. Or go through Google Streetview, and find posted limits in archived images.
McTighe said she would love to easily match crashes with posted speed limits, but it would require more person hours than Metro has at the moment.
Another deficiency that I pointed out is the lack of information about nearest marked crosswalks in pedestrian crashes. Media reports will often point out that a pedestrian crash victim was “jaywalking,” casting the blame squarely on the person who was struck. However, on many roads urban roads — and Portland is probably typical in the United States — marked crossings are few and far between. This does not constitute a safe system.
McTighe said one obstacle in getting location data about marked crossings is that Oregon doesn’t have a legal standard for minimum frequency of marked crossings. In fact, Oregon roads have no legal standards for safety at all — only non-binding goals at this point. What the state does have are legal standards for vehicle throughput, and this is just one of many factors that stacks the deck in favor of driving in the ongoing fight for safe streets.
— Greg Spencer
Never miss a story. Sign-up for the daily BP Headlines email.
BikePortland needs your support.