
(Photo: J. Maus/BikePortland)
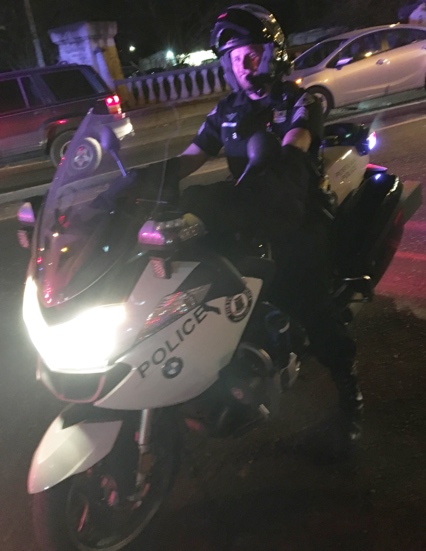
On the same night hundreds of community members took over the lanes on the St. Johns Bridge for a solemn memorial and protest event, the Portland Police Bureau was doing their part to raise awareness of safety issues.
The Traffic Division is stationed right at the eastern end of the bridge and they took advantage of their presence on last night’s ride to conduct an enforcement action — a.k.a. “traffic safety mission”. The bureau also said the recent death of Mitch York was a key motivator of this action.
The result: According to a police bureau statement they made 43 stops in just two hours. 30 citations were written and they made 13 warnings. The violations were “numerous” but predominantly for speeding. One person was arrested for driving on a suspended license.
Imagine if we did more enforcement like this and Joel Schrantz — the man driving with a suspended license who lost control of his vehicle and killed Mitch York on Saturday — was arrested before he had a chance to commit that tragic act of violence?
Advertisement

And imagine if we designed our roads in such a way that we needed less enforcement. Despite the fact that nearly everyone drives over the speed limit on the St. Johns Bridge, so far the Oregon Department of Transportation has done nothing to address it. This past week I’ve been researching the fateful decisions they made in 2002 to maintain the four, 10-foot standard vehicle lane configuration we have today. As early as 2001 local planners and engineers were pointing out that the bridge was a dangerous thoroughfare where illegal speeding was rampant.

One document that presented several different lane configuration options included a chart of the 85th percentile speeds in 2002. The 85th percentile speed is what engineers use to set speed limits (an absurd practice that should be abolished, but that’s a different conversation). It means that 85 percent of people drive at or below the speed and 15 percent go faster.
As you can see in the chart, in 2002 all most of the traffic was going above the posted speed limit — with people in cars choosing to drive 9-12 miles above the limit.
Perhaps it’s time for ODOT to consider taking measures to reduce speeds on the bridge? Photo radar cameras would help, as would reconfiguring the lanes or perhaps adding rumble strips on the span.
Expecting the police to enforce speeding 24/7 is ridiculous. We must begin to change driving behaviors and more humane road design is a great place to start.
— Jonathan Maus, (503) 706-8804 – jonathan@bikeportland.org
BikePortland is supported by the community (that means you!). Please become a subscriber or make a donation today.