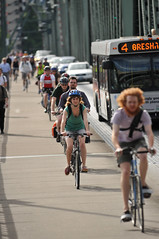
trips are made by bike over
Portland’s four main downtown
bridges every day.
(Photo © J. Maus/BikePortland)
PBOT released their 2011 Bicycle Counts Report today (PDF). The numbers show that overall there were 6.4 percent more trips made by bike citywide in 2011 compared to 2010. On new neighborhood greenways, the jump in ridership was even greater. At the 11 newly-developed neighborhood greenways (a.k.a. bike boulevards), PBOT recorded a jump of 61 percent.
The Going Street neighborhood greenway saw a particularly large spike with a daily count of 1,585 bicycle trips at NE Going and 9th last year compared to 1,040 daily bicycle trips in 2010.
Overall, bike traffic in Portland is up 219% since 2001. In addition to trip data, the counts also shed light on the gender split (big news on that below), reported collisions, helmet use, and seasonal averages over time.
On the four main downtown bridges — the Broadway, Steel, Burnside and Hawthorne — bicycle trips were up 3.8 percent. In 2011, there were a record 18,257 daily bicycle trips over those four bridges which accounts for over 15 percent of all vehicle traffic (and that’s with an 18 percent drop on the Broadway due to streetcar project related detours and closures). The busiest bridge is the Hawthorne, which has an average of 8,044 daily bike trips. The Steel Bridge follows with 3,703 average daily trips.
Starting in 2010, PBOT counted bicycle traffic on the Hawthorne Bridge throughout the year — not just in the warm, dry summer months of July through September that the rest of their counts are taken in. This means they can now offer a detailed comparison of summer and winter counts.
According to the 2011 report, the amount of bike trips taken on the Hawthorne Bridge during October 2011, 6,662, is more than the summer counts in 2007. The 4,401 trips taken in December of last year are equal to the summer counts in 2004. This means that each year, people who ride in Portland are getting tougher and more people are riding throughout the cold and wet months!
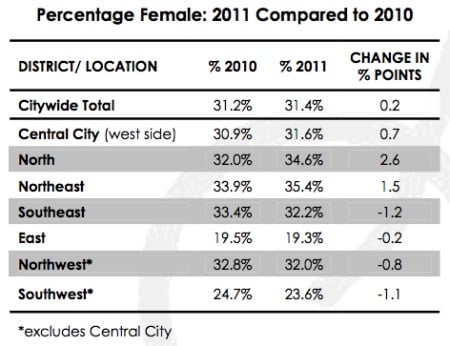
When it comes to the gender split, the overall male/female counts increased a paltry 0.2 percent between 2010 and 2011. Overall in 2011, 31.4 percent of people counted on bikes were women. The number of women on bikes is highest in northeast Portland (35 percent) and lowest in east Portland (19 percent). The count location with the lowest number of women riders was SW Barbur and Capitol Blvd where they represented just 7 percent of the total number counted.
There was one location where PBOT recorded more female than male riders. Of the 260 average daily bike trips at N. Failing and Missouri, 58 percent were women.
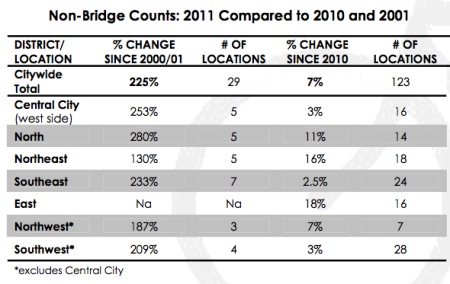
The highest non-bridge location counted in 2011 was SE Harrison and Ladd Circle with 3,600 average daily trips.
More riders than ever were recorded as wearing helmets. Citywide, 80 percent of people counted wore them, that’s up 3 percent over 2010.
PBOT also tracks collision data; but because they rely on state DMV records, the numbers lag one year behind the bike counts and are hard to extrapolate too much from. That being said, the number of reported collisions has not gone up for the third year in a row. There were 321 reported collisions involving bicycles in 2010, that’s up from 287 in 2009 and 265 in 2008. PBOT officials say the rising number is a result of the Portland Police Bureau investigating more bicycle collisions and that it is not “representative of changes in actual crash activity within the city.”
Geek out to all the stats and graphs in the full report here (PDF, includes counts from previous years).
*Below is section on count methodology taken from the report:
Bicycle counts are conducted by volunteers and City of Portland staff, who visually count and then record passing bicycles at street corners and on bridges during two-hour time slots called a “peak period.” In the last ten years, PBOT added several automatic bicycle counters on bridges and trails. These counters provide a more complete picture of the ebb and flow of bicycle traffic over the course of the day and throughout the year.
For visual counts, volunteers record counts for each direction during peak periods at a location and report the number to PBOT staff. A 24-hour average bicycle count for the location is calculated by multiplying the recorded peak period count by five. This is a standard traffic engineering calculation that has been validated by comparing extrapolated visual counts with comparable results from automated counters.
Prior to 2008 the majority of counts were concentrated in the center of the city. Since then, PBOT has worked to increase the total number of count locations and expand the locations across the city, with extra focus on adding locations in Southwest and East Portland. In 2008, there were 121 locations and in 2011 there were 156.To determine year-on-year percentage change in counts, PBOT staff compare only those locations and their count totals that were recorded for both years. New locations and the total counts recorded at them are not compared to previous years’ totals.


Surely the mild December we just had beats any “lousy” summer weather in ’04. That’s a big deal.
But Hawthorne counts are also up thanks to the Morrison closure, too. So long as you don’t need convenient access to either waterfront, or a good route to any of the streets north of Hawthorne, I guess Burnside is fine, but…
Doing the gender count visually seems pretty iffy to me. I see boys who look like girls and girls who look like boys all the time (and I like it), so it seems like a pretty good percentage would fall into the category of “who knows?”
as a counter myself, i agree that there are judgment calls to be made, but i am going to suppose that errors in each direction might tend to offset, unless you have data indicating a bias in one direction or the other. possibly in some distant future, we will get away from binary gender assignment altogether. in the meantime, i am guessing PBoT wants this data to build a case for making more greenways, because the percentages for female ridership are higher there.
In theory it’s iffy, but I’ve only rarely had a question. That’s one advantage of summer counts.
Gee, look at that, Build It (Neighborhood Greenways) and they will come.
Add PBOT goes slashing the Greenways budget, despite such positive numbers. The Greenways are the best things since Bike Lanes. Build more and we’ll see more people on bicycles.
They are also great for those new to town (not me) and for tourism, for those folks who visit Portland and want to get around SAFELY on bicycle.
Oops, I meant “and”, not “add”…
From above, “The count location with the lowest number of women riders was SW Barbur and Capitol Blvd where they represented just 7 percent of the total number counted.” There roads need tons of TLC.
Sadly Barbur won’t get much work done until a decision is made about putting a MAX line out to Tigard.
“Add PBOT goes slashing the Greenways budget, despite such positive numbers.”
If the bean counters were thinking beyond this coming fiscal year (and holding up their pinkie fingers into the winds), I would think they’d want to align spending with the modes that have a future (human powered) and cut those that don’t (fossil fuel based).
I’d like to hear some arguments for why not to do this….
Because cars won’t run on fossil fuels forever. Once they don’t, and we’re already moving in that direction, two big motivating factors not to drive (environmental impact and cost of fuel) go away.
Unfortunately I think it would be ill-advised to make policy based on that kind of wishful thinking. Better to play it safe and count on what we already know how to do.
The only cars around here that don’t run on fossil fuels that I’m aware of run on biodiesel and renewable electricity. The fraction of the current fleet that falls into these two categories is surely <1%. We cannot expand either of those fuels to cover even 10% of our current demand for driving, much less all of it. The chief reasons are that
(a) there are competing demands on agricultural land and for renewable electricity, which will only intensify, and
(b) the money, political will, technical knowhow, not to mention energy and resources necessary to transform our infrastructures to support non-fossil fuel powered cars and trucks across the board is very hard to imagine happening in the next twenty years.
there will always be new sources of energy, man. i was reading somewhere the other day about people trying to engineer plants to process a broader range of light energy. those silly plants are only working the visible spectrum, wtf?
the experiment we are ultimately running here is whether there is some constraint other than energy on our endless appetite for growth.
“there will always be new sources of energy, man.”
Sure, but not with the energy density of fossil fuels and that is what makes all the difference.
http://www.masterresource.org/2010/04/energy-density-is-key/
What? Hardly. Conservation of energy precludes that.
Pick your option:
solar
wind
tidal
hydro
coal
oil
oil shale
natural gas/methane
biofuels
biomass
All of the above are created from solar energy.
That leaves these guys:
nuclear fission
nuclear fusion
As the only 2 sources of energy that don’t rely upon the sun. And we’re actually running out of uranium, before 2100. Fusion isn’t feasible yet.
a great deal of sunlight, including especially stuff outside the visible spectrum, simply hits the ground and is not exploited as energy.
Hey, much to improve upon but I’m struck by the tone of the comments here. There is much to celebrate in these numbers and many people to thank for their tireless efforts to get us to where we are. I often think that Portland congratulates itself too easily, but this is an instance where pausing to reflect is very worthy. A good reference point: in 1990 there were 15 bikes a day across the Broadway Bridge in winter. This is transformative stuff and what behavior change starts to look like when it scales. Very cool.
Jonathan, you’re far more in the loop than the counters are. I love the winter numbers (but they can continue to do those automatically – I really don’t want to stand out there for two hours in the rain, dark and cold).
As a volunteer , I have done about 20 counts the past two summers, mostly in SW Portland. I respectfully disagree that the gender counts are questionable or inaccurate – if one is paying attention – but admit that my count locations do not have the really high numbers, ie pods & groups of cyclists streaming by during the pm peak.
I did the counts at the Barbur & Capitol Hwy location in 2010 and 2011. I agree this major crossroads needs needs TLC to better serve bikes, peds, and transit users, but there are interim improvements that could be made prior to implementation of future high capacity transit (Portland to Sherwood) in this corridor.
Funding is very difficult to find, but I think that the notion that: “nothing can be done until LRT fixes everything someday” is a myth.
We (SW active transportation advocates) are engaged, we have the attention of ODOT Region 1 management, plus good relationships with ODOT traffic engineers.
An example:
http://newspaper.swni.org/Barbur%20Capitol%2012-22-10/Safety%20Study%20Barbur%20Capitol%20Hwy%20I-5%2012%2020%202010.pdf
Some of the improvements are already implemented…
Does anyone have stats that show the make up of cyclists nationwide/ local by race/ ethnicity?
Does anyone have stats linking GPA in school or high school graduation based on whether kids ride bikes or are driven to school?
Some good stuff here:
http://www.bikesbelong.org/resources/stats-and-research/statistics/participation-statistics/#Demographics
Wow. John R. I didn’t find what I was looking for exactly, but WOW did I find some cool stuff!
Nice work, Portland. It shows that if we keep the infrastructure growing and education programs, we make it possible for even more folks to use bikes for daily transportation.
Ted Buehler
The Oregonian covered this in their Tuesday print edition, and in the Wednesday print edition there’s a bike-positive editorial.
Comments are open in both stories.
http://blog.oregonlive.com/commuting/2012/02/portland_bicycle_traffic_grew.html
http://www.oregonlive.com/opinion/index.ssf/2012/02/biking_the_path_to_urban_healt.html
Ted Buehler