

Nearly four months after it launched, the City of Portland’s ambitious plan to eliminate serious injuries and traffic deaths by 2025 is beginning to take shape. Today the bureau of transportation (PBOT) released an update on their efforts that includes a newly agreed-upon vision statement and a 78-page presentation (PDF) that was given to members of the Technical Advisory Committee of the Vision Zero Task Force last week. The presentation is full of crash data and ideas on how to make our streets safer for all modes.
It offers the first glimpse into the concrete steps PBOT might take in this unprecedented safety effort.
Here’s the vision statement:
“Working together we will take equitable and data-driven actions that will eliminate serious injuries and deaths for all who share Portland streets by 2025.”
How can a road safety plan be equitable? PBOT says they’ll use data and a network gap analysis to make sure that Vision Zero plans address the disproportionate impact of traffic fatalities and injuries on “vulnerable communities, including people of color, lower income individuals, seniors, children and people who walk, bike and use transit.” PBOT says any stepped-up police enforcement, “will not result in racial profiling.”
The city says any actions taken under the Vision Zero banner will be data-driven. This can be a red flag for biking advocates because crashes are woefully underreported and existing data sources don’t take into account all the people who don’t use certain streets due to safety concerns. But PBOT says they’ll gather data from “both traditional and innovative sources.” Does that mean they’ll use crowdsourced data from sites like nearlykilled.me and Ride Report?
In the fight for traffic safety, the importance of data goes way beyond simply where and how crashes happen. To their credit, PBOT says they’ll use it to analyze things like demographics of impacted communities, enforcement data, accountability of their own effort via publicy accessible “dashboards,” community engagement, and more. “Success will be measured,” they say, “by the level of investment in underserved communities, equity outcomes and safety metrics.”
In another sign of progress, PBOT has identified its top four culprits in traffic deaths and injuries: speed, alcohol/drug use, intersections, and “high crash corridors”. In their 78-page presentation they address each of these factors with a series of datapoints and action plans.
Advertisement
It’s a barrage of data and analysis that shows PBOT is taking this Vision Zero effort seriously and it sets them up for success later as hard political/project decisions arise.
In the 10 years between 2004 and 2013, there were 333 fatal crashes and 2,145 serious injuries. Here’s a breakdown by mode:

Of those fatal crashes, 62 percent were drug and alcohol related (12 and 50 percent respectively) and 32 percent were caused by speeding. Whether you bike, drive, or walk, you’re three-times more likely to die on a road with a speed limit of 35 mph or higher.
One of the most interesting bits of data presented by PBOT is a new list of the top 25 most dangerous intersections and high crash corridors broken down by mode.
The intersection rankings use data from 2010-2013 and were based on four factors: number of crashes, collision rate, value (in dollars) based on severity, and value rate (dollars per million entering vehicles). Here’s the list (note that nine if the top 10 are east of 82nd and five of the top ten are on SE 122nd Ave):

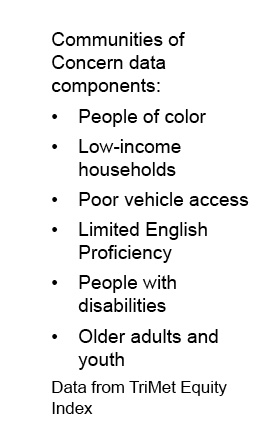
And here’s how PBOT is integrating equity with data to inform their plans to improve traffic safety. The map below shows the top 25 high crash intersections for all modes laid over the boundaries of “communities of concern.” PBOT defines communities of concern as those with a higher instance of people of color, low-incomes, poor vehicle access, limited english proficiency, people with disabilities, and older adults and youth.
Note that 22 of the 25 most dangerous intersections (for all modes) are in “communities of concern”:

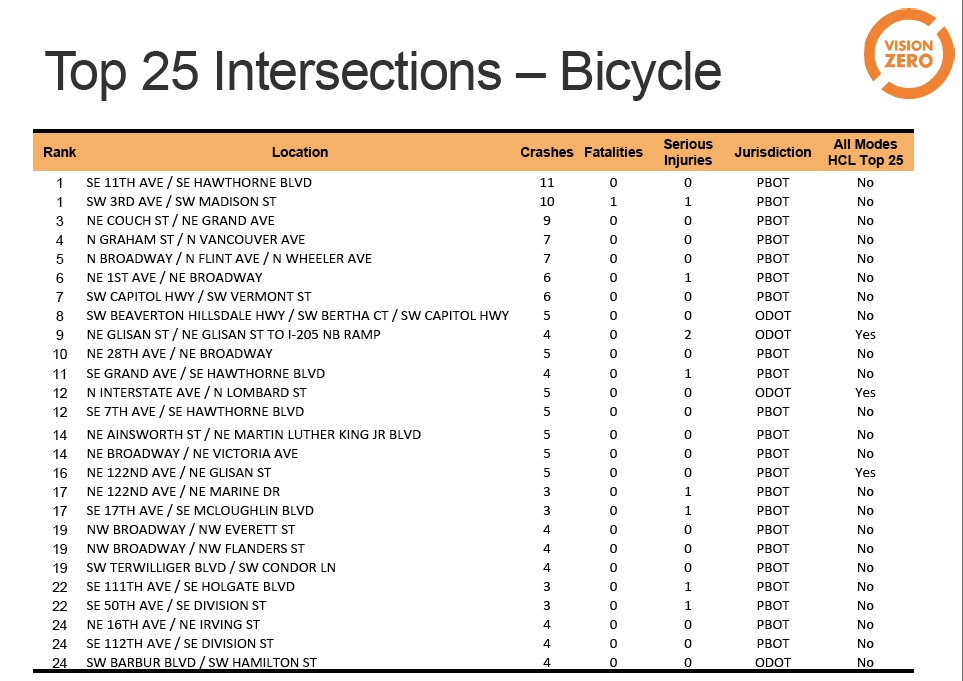
PBOT also ranked dangerous intersections for bicycle collisions (of all severities)*. These rankings were based on total number of crashes and value (in dollars) of injuries based on severity. Note that only 10 of the 25 most dangerous intersections for bicycling are in communities of concern and only four of the 25 are east of 82nd Ave:

A similar approach was made to map the most dangerous high crash corridors. Based on data from 2004 to 2013, here’s a listing of the top 25 most dangerous bicycling corridors followed by a map view:


When it comes to fixing these dangerous areas and ultimately eliminating fatalities and serious injuries in 10 years, PBOT has laid out a host of approaches.
To thwart the impacts of impaired driving, PBOT says engineers could include physical separation on roads with a 35 mph or higher posted speed and better lighting. From a policy standpoint, ideas listed include greater use of alcohol ignition interlock devices, a free taxi program, and pre-paid morning parking (which is something Seattle passed a few years ago to encourage folks to leave their cars downtown after a night of drinking without fear of a parking ticket).
To reduce speeding, PBOT floats the possibility of a lower speed limit citywide, a strong anti-speeding marketing campaign, road diets, and other traffic calming measures.
These and other actions will be discussed at the Vision Zero Task Force’s next meeting on February 25th.
*NOTE, Tuesday 12/8 at 4:30 pm: This post initially had an incorrect chart of the top 25 most dangerous intersections for bicycling. That chart has been updated. We regret the confusion.
— Jonathan Maus, (503) 706-8804 – jonathan@bikeportland.org