
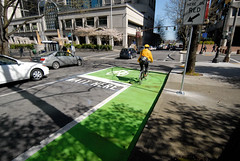
(Photo © J. Maus/BikePortland)
New data released by the Portland Bureau of Transportation (PBOT) yesterday shows that collisions have gone up significantly at four of 11 intersections where bike boxes were installed in 2008. While longer-term policy and infrastructure changes are in the works for next year, PBOT has announced interim measures aimed at improving safety at those four intersections — one of which is SW 3rd and Madison where Kathryn Rickson was killed back in May.
After Rickson’s death, PBOT was (once again) forced to address critics and rising concerns that they have not done enough to reduce the number of right-hook collisions throughout the city — an issue that has plagued PBOT for years. The announcement of new safety measures and the increase in right-hook collisions came in a letter from City Traffic Engineer Rob Burchfield to the Federal Highway Administration’s Transportation Operations Director Mark Kehrli. The letter is a progress report related to the City’s ongoing FHWA experiment with bike boxes and colored bike lanes.
In the letter, Burchfield says that despite a significant increase in bicycle traffic at the intersections and a higher volume overall of reported bicycle collisions (due to a change in police practices in 2008), PBOT still believes that, “the crash data trend suggests that right-hook crashes are increasing.”
According to PBOT’s analysis, in the four years prior to the bike boxes being installed (2004-2007), there were a total of 16 bicycle-involved right-hook collisions at the 11 intersections. During the four years after (2008-2012) there were 32. Of those 32 collisions, 26 of them (81%) occurred at four of the 11 intersections. (By comparison, at the seven other locations, there were seven right-hooks prior to 2008 and six after.)
The locations responsible for the increase in collisions are:
- SW Madison at 3rd
- SE Hawthorne at 7th
- SE Hawthorne at 11th
- NW Everett at NW 16th
“The 85% speed* for cyclists observed overtaking right-turning vehicles was approximately 18 mph, which we find to be fast speed for the condition.”
— Rob Burchfield, City Traffic Engineer
Put another way, the annual average number of collisions at the four locations above went from 2.25 prior to the installation of green bike boxes and bike lanes, to 6.5 per year after installation. By comparison, the seven other locations saw a decrease in collisions from 1.75 per year to 1.5 per year.
This surprising increase in right-hooks led PBOT to take a closer look at what is happening at these four locations. From reading police reports they found that 88% (a “high proportion”) of the collisions occurred during a “stale” green signal. Or in other words, the collisions occurred when the light had been green for some time and not during the red phase or right as the light turns green. After observing the locations, PBOT also determined other similarities in the behavior of road users that they feel are directly contributing to the collisions:
- All three locations have downhill grades on the treatment approach.
- The 85% speed* for cyclists observed overtaking right-turning vehicles was approximately 18 mph, which we find to be fast speed for the condition.
- A high percentage of cyclists were overtaking right-turning vehicles during the peak-hour observation periods.
- A very high percentage of vehicles (98%) yield to cyclists over-taking on their right.
(*”85% speed” is a standard measurement for traffic engineers. In this case, it means that 85% of the riders are traveling at 18 mph or less, or that 15% of them are going over 18 mph (thanks for the explanation Art Fuldodger).)
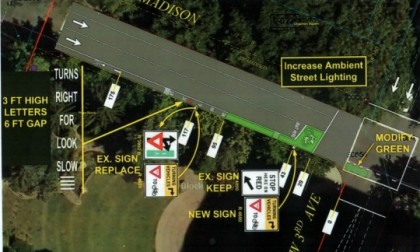
PBOT has concluded that the speed of people riding is a “likely contributing factor that may explain the safety performance of these treatment locations.” Based on their analysis and observations, PBOT says they plan to modify the design of these four intersections. By next year, we can expect to see several new measures implemented including: a separate right turn lane; the prohibition of all vehicle right turns; a separate signal phase for through bicycle traffic (like on N Broadway at Williams); and special signage activated by people on bikes to warn drivers of potential conflicts.

While those longer-term will have to wait until 2013 (most of PBOT’s construction shuts down during the wet and cold season), they have announced interim plans (in graphic above) for the four hot-spot intersections that will include: new ‘Right Turn Yield to Bicycles’ signs; supplemental pavement markings in the bike lane prior to intersections that read, ‘SLOW, LOOK FOR RIGHT TURNS’; and they will modify the green pavement in the intersection into a “broken green pattern” in order to “more clearly communicate that this is a conflict area to people riding bicycles.”
——
This is an interesting development from PBOT. Their findings that high speed bicycling is to blame in these collisions could expose them to criticism and “blaming the victim”. Oregon law is clear that “failure to yield” to a bicycle rider is illegal; so it would seem that in right-hooks, the person driving the car has a lot of the responsibility to ensure they don’t hit someone on their right. How did PBOT make its determination that the speed of the person bicycling was a factor — even when that person was going under the posted speed limit? The DA’s finding on the Rickson case (which essentially implied that Ms. Rickson was partially responsible for the collision because she attempted to overtake a right-turning truck on the right), definitely played a role in forming PBOT’s perspective. So much so that they included the DA’s full decision as an attachment to their letter to the FHWA. PBOT also has motivation to find speedy cycling at least partially to blame. They have been under a lot of pressure to “fix” the right-hook problem and telling people on bikes to slow down and insinuating that it’s the bike riders’ fault — and not the design of the roadway — is certainly more convenient and politically palatable.
Stay tuned for more coverage and thoughts. For more background, read Burchfield’s letter to the FHWA and take a closer look at the changes planned for the four intersections in this PDF (8 MB).