
(Photo © J. Maus)
The City of Portland Bureau of Transportation released results of their 2010 bike counts today (PDF here). The counts — taken at 153 locations throughout the city — show that bike use climbed in Portland this year after a small dip in 2009. According to the report, the number of bike trips taken in 2010 is up about 8 percent over 2009. Since PBOT began these annual counts in 2000, bicycling has tripled, growing by 190 percent.

way up this year
after a drop in 2009.
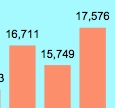
On Portland’s four main downtown bridges with bikeways (Broadway, Steel, Burnside and Hawthorne), the 2010 counts showed a 12 percent increase — the highest number of bike trips since PBOT’s annual counts began in 2000. Bike traffic now makes up about 14 percent of all traffic on those bridges (up one percent over 2009). On an average weekday, 17,580 Portlanders cross the Willamette River via these four bridges.
Citywide, all seven districts showed ridership growth over last year. The highest gains were found in Southwest Portland and East Portland with 19 percent and 9.5 percent respectively.
Here’s a chart taken from the report that shows the increase in bike traffic from last year and from 2000-2001 at both bridge and non-bridge count locations:

PBOT has also been measuring the rate of helmet use since the early 1990s. The number has grown from 44 percent in 1992 to 77 percent in 2010. Southwest Portland leads the way with 88 percent of the riders wearing a helmet and in East Portland, just 59 percent of riders wear one.
31 percent of riders counted were female, a figure unchanged from 2009. Here’s a neat chart from the report that I don’t think they’ve done in past years. It shows the best and worst intersections in Portland in terms of the share of female riders:

When you view the data in map form, you can where women ride (green dots are locations with high female mode split, red dots show low female mode split):

PBOT also measured the difference in bike traffic between the summer and winter months. They found that, on average, bike use in winter is about 33 percent less than summer. That being said, the amount of winter riders has increased substantially over the years. Winter counts done this year on the Hawthorne Bridge are comparable (and sometimes more than) the summer counts recorded in 2006.
From 2002 to 2009, PBOT added only 28 new miles of bikeways. But in the last year alone, PBOT has added 43 new bikeway miles.
Last year, PBOT offered an explanation for the first decrease in bike traffic the city has experienced since 1995. In their analysis, they wrote, “The pool of people willing to use a bicycle for transportation is almost exhausted given the appeal of the city’s current bicycle transportation infrastructure.” Now it looks like PBOT might be finally turning the corner into creating the type of infrastructure to attract new riders. After remaining relatively flat since 2002, the number of “bikeway miles” added by PBOT jumped significantly in 2010. From 2002 to 2009, PBOT added only 28 new miles of bikeways. But in the last year alone, PBOT has added 43 new bikeway miles.
PBOT counts are compiled by a mix of trained volunteers and automatic hose counts over a two-hour peak period. That number is than multiplied by five to provide an estimate of total daily bicycle traffic at each location (this is standard practice in the engineering world). The 2010 counts were done between July 20th and September 30th.
See how ridership has grown in relationship to the number of bikeway miles and read the full 2010 PBOT Bike Count Report by downloading the PDF.
— Read more about PBOT’s bike counts on their website.